- Close your application and all dotTrace instances - Clear %temp%\jetlogs folder - Run dotTrace - Prepare to profiling, press Ctrl+Alt+Shift+F11 - Enable "Enable logs" checkbox in "Expert Options" window - Enable checkboxes: Com, Api, MetaDataGt - Save settings - Run profiling, get an error - Find logs in %temp%\jetlogs folder and send them to us
You can submit a request and attach your logs here:
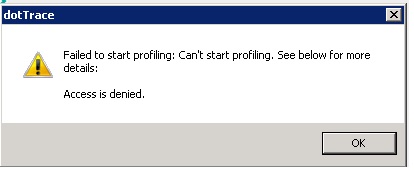
Hello, I have exactly the same error with the first version of dotTrace 10. I can attach it to an existing process but only in sampling mode. I need to run a IIS Application profiler in tracing. Thank you for the helop. Best regards.
Hello Pierre-Yves Dubreucq,
Could you please collect core logs for us:
- Close your application and all dotTrace instances
- Clear %temp%\jetlogs folder
- Run dotTrace
- Prepare to profiling, press Ctrl+Alt+Shift+F11
- Enable "Enable logs" checkbox in "Expert Options" window
- Enable checkboxes: Com, Api, MetaDataGt
- Save settings
- Run profiling, get an error
- Find logs in %temp%\jetlogs folder and send them to us
You can submit a request and attach your logs here:
https://dotnettools-support.jetbrains.com/hc/en-us/requests/new
Hello,
What version of operating system and IIS do you have? What version of dotTrace is installed on your machine?
Kind regards,
Maria
Hello, I have exactly the same error with the first version of dotTrace 10. I can attach it to an existing process but only in sampling mode. I need to run a IIS Application profiler in tracing.
Thank you for the helop.
Best regards.
Eric