Profiling SQL queries in async code
We have a WPF application with a large async codebase, where I'm trying to track down an issue with an SQL query being executed very often. dotTrace Timeline shows me which queries, and that lots of time has been spent waiting for it, but I'm having trouble figuring out which method is executing this query.
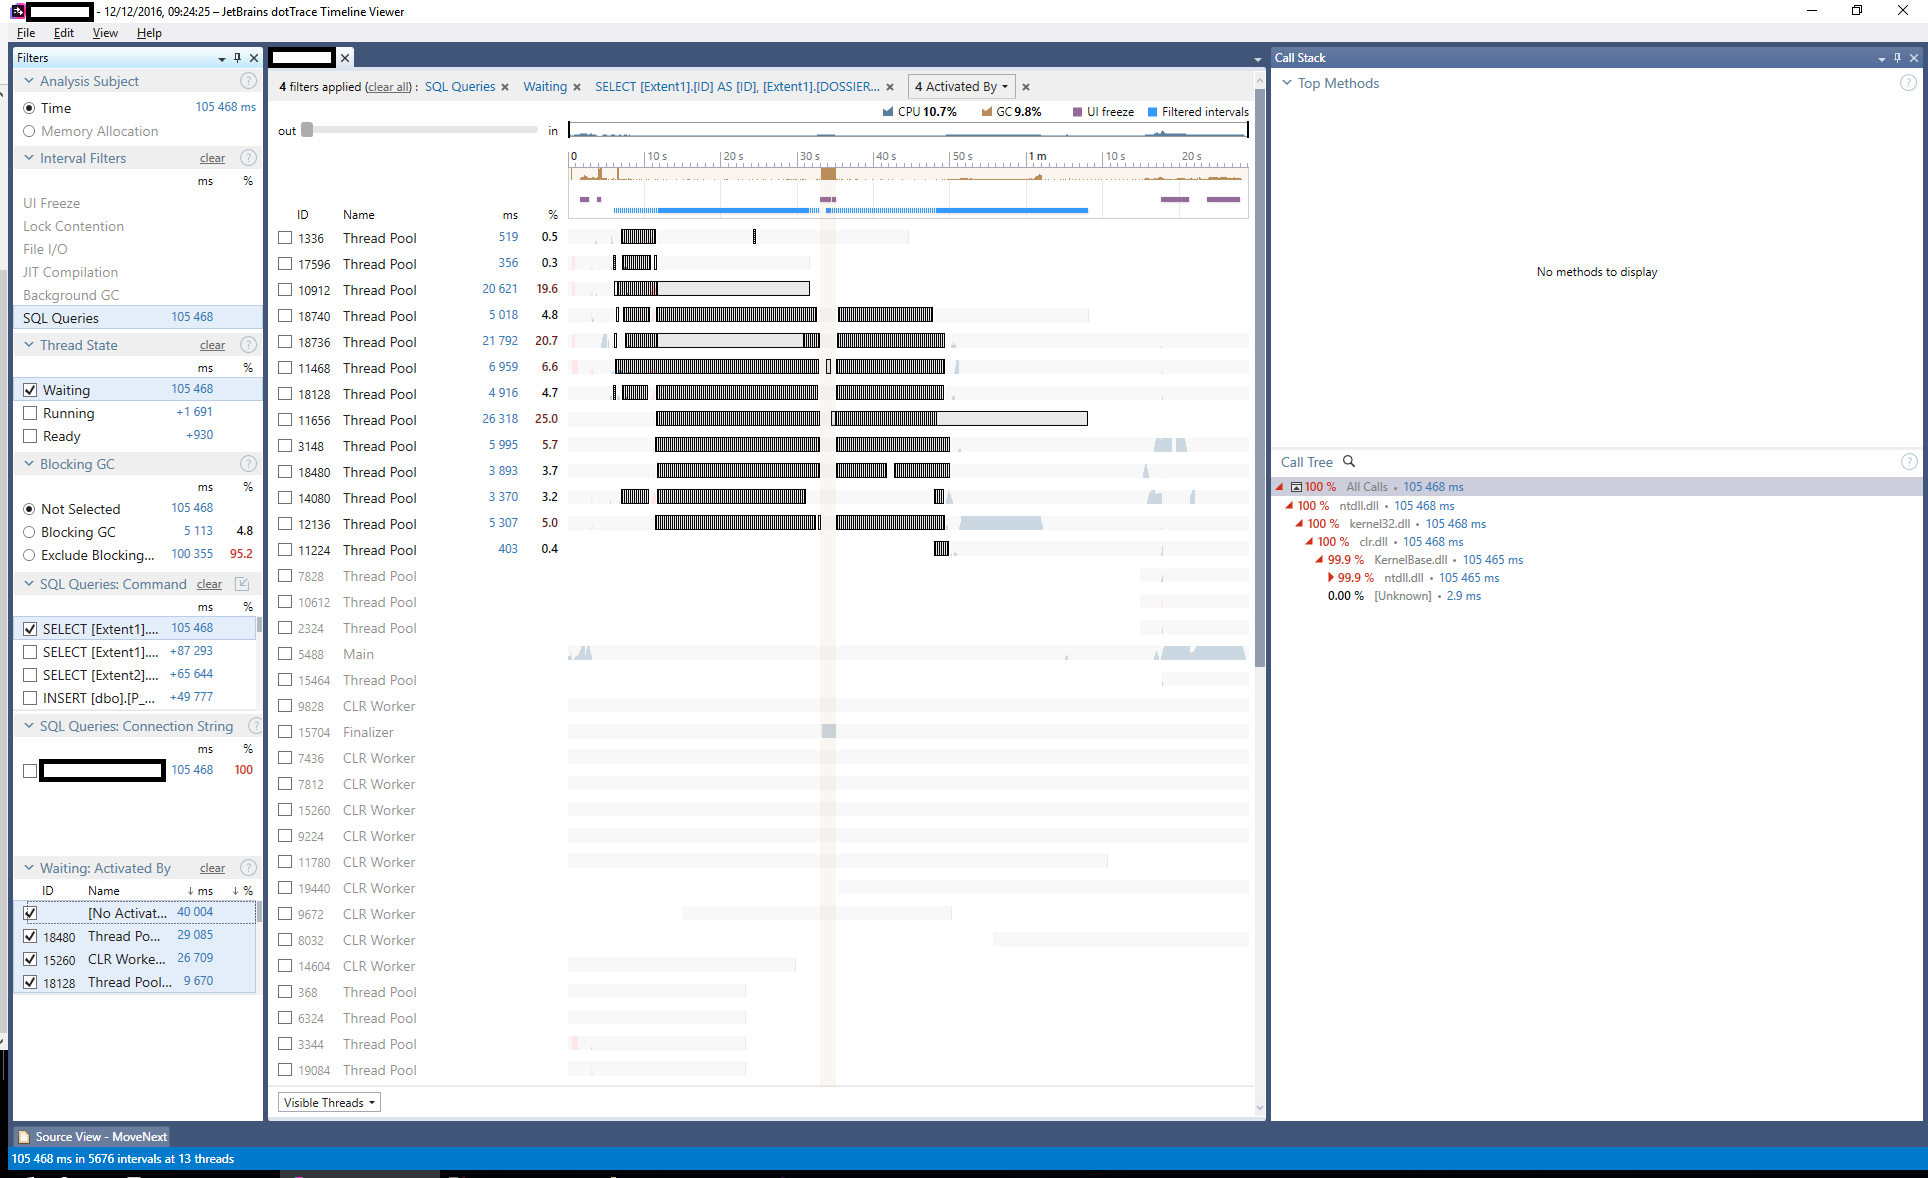
As you can see in the following screenshot, selecting this query shows me nothing at all:
I followed the guide here to drill down to this result.
How can I figure out which method is causing this?
Please sign in to leave a comment.
Hi,
What OS are you using? Did you try to fold system calls in call tree (icon near the All Calls)? Is it possible to send us the snapshot for analysis (you can do this privately using Submit a request button in the upper right corner)?
This is on Windows 10 Home 64-bit, with all the latest updates. I'll send you the snapshot privately.