dotTrade won't "run". Button greyed out.
dotTrace refuses to run.
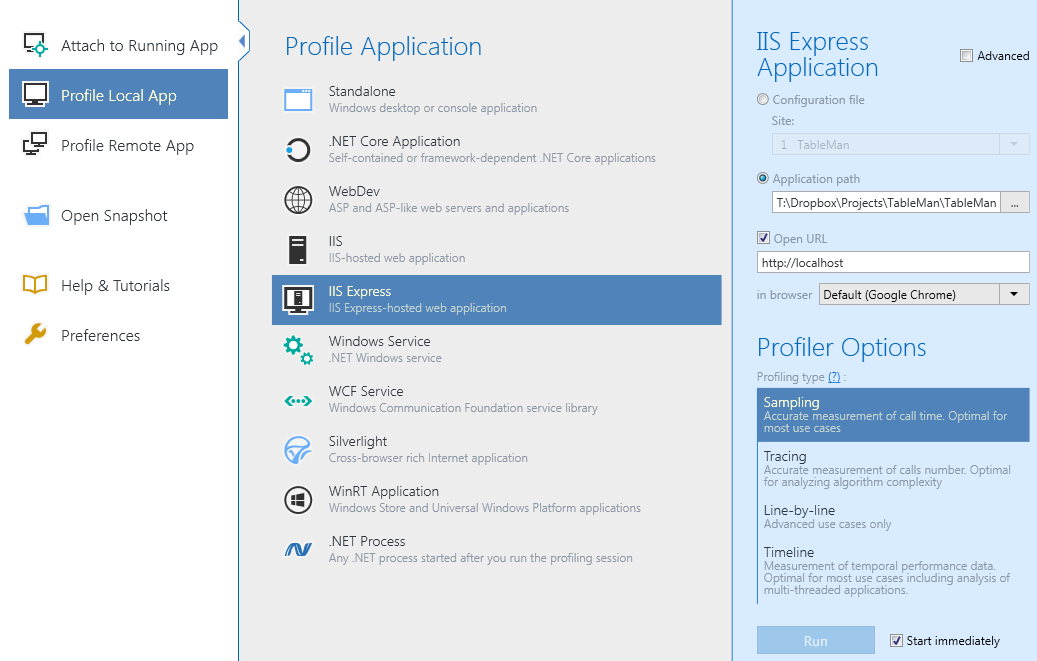
- The tutorial (https://www.jetbrains.com/help/profiler/Profile_ASP_Web_Site.html) for locally profiling doesn't mention the existence of IIS Express (though I suspect that 90+% of locally tested projects use IIS Express rather than IIS), rather than clicking "IIS" as the instructions say, I selected "IIS Express". Step 3, by the way, has a typo.
- When I specify "Configuration File", only "Website1" is shown, though the application runs under website "TableMan". Note that I am using IIS Express 64-bit.
- When I explicitly specify a configuration file by enabling "Advanced", the correct website is detected, but all dotTrace ever shows is "Waitinf for a managed application to start..."
- When I specify by the exact URL used to test the application, which includes a port, I get the error "URL port is different then service port" (FYI this is incorrect grammar, should be "than service port).
- When I remove the port number, which is not at all obvious, the "Run" button is simply greyed out without warning or error message. Clicking it does nothing. Running the site in Visual Studio does nothing. Kind of not impressed so far, though it's probably my misunderstanding.
Please sign in to leave a comment.
Hi Charles,
- You're right; there is no section about IIS Express in our documentation. We'll add it soon.
- "Configuration file" option by default uses the general IIS Express configuration file, which stores information only about projects made in VS 2010/2012/2013. If your project was made in a newer version of VS, you need to manually specify configuration file path (<solution folder>\.vs\config\applicationHost.config).
I fully agree that it is not obvious at all, we'll remake it in the next version of dotTrace.
- "Waiting for a managed application to start" message means that there is no managed IIS Express process detected. You need to open any page which uses managed code to continue profiling.
- The port number specified in the "port" field should match to the port from URL. About "then service port" misprint - thank you, we'll fix it.
- About the greyed out "Run" button - unfortunately, I can't reproduce this issue on my side. Are you sure that another profiling session was not running when you tried to start profiling?
In your case, you can specify a configuration file and an URL without a port number (as it is already specified in the configuration file) or specify an application path and an URL (also without a port number, leaving the "Autodetect" checkbox checked).
Also, you need to check that the specified page uses a managed code.