DotMemory always show 0.0B memory used when Sophos Antivirus is active

Hello everyone,
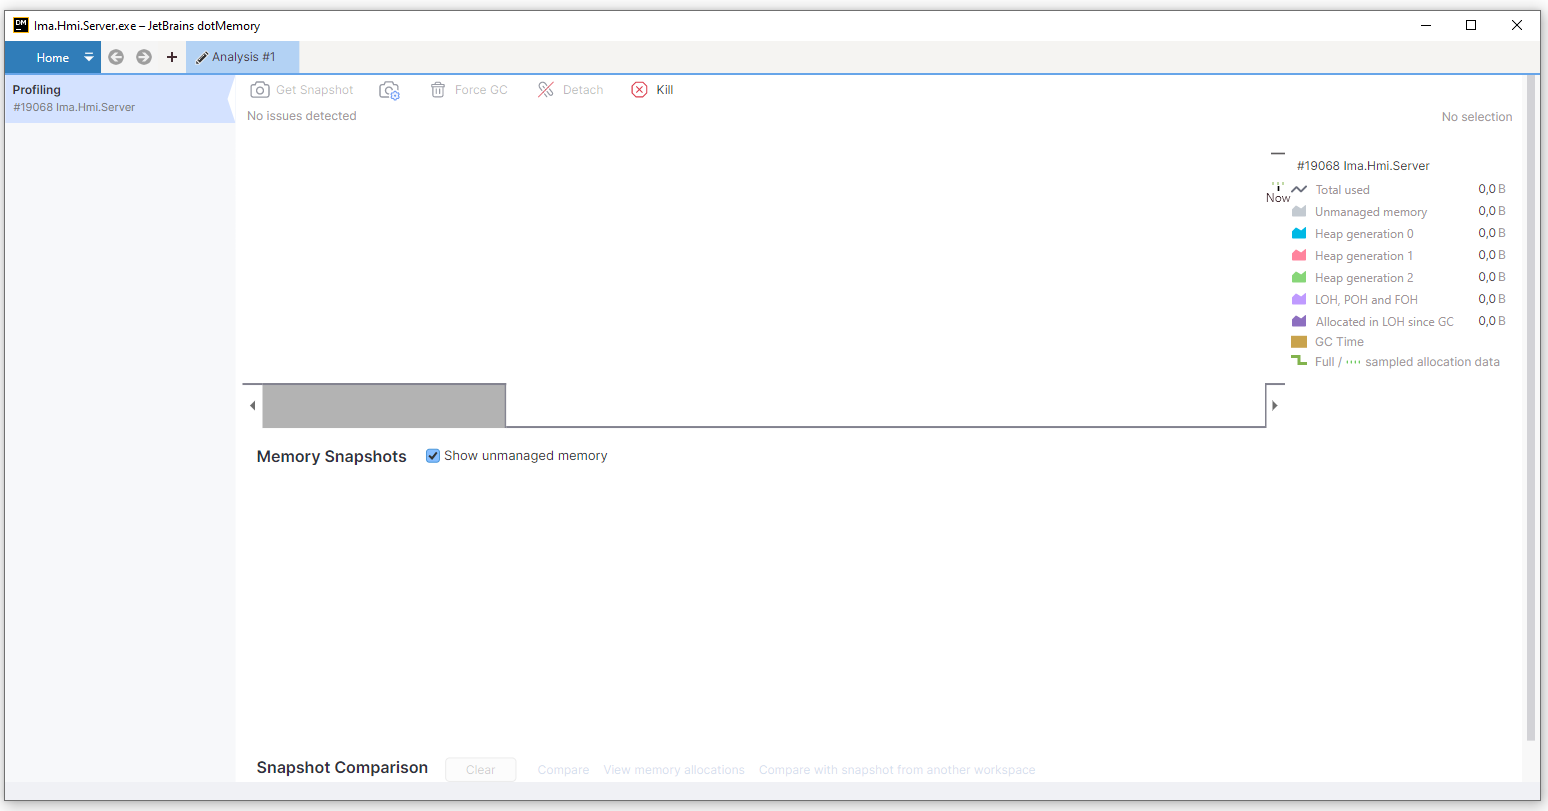
I'm trying to debug a memory leak for our software, but lately starting the profile both on Visual Studio Dotmemory integration and Dotmemory as a standalone creates the process but seems like paused, and 0.0B memory used in the graph is shown.
Doing some tests, we noticed that disabling our Sophos Antivirus, it start profiling again. Naturally we can't ask out IT office to keep disabled the Antivirus, so we need to understand what's happening.
I've made a log of Dotmemory with trace enabled, Upload id: 2025_10_06_JXt2XHGyvu964Sg9iQb4vR (file: JetBrainsLog.JetBrains.2025-10-06T14-24-11.dotMemory_UI_64#41320.log) . We already tried to put the file scanning exclusion of AppData\JetBrains directory and the output bin folder of our software.
Thanks for you help!
Alberto
Please sign in to leave a comment.
Hi!
This is a known issue with the Sophos Antivirus software.
Could you please check if excluding dotMemory from Monitor Domain Controller Events and/or Hollow Process policy resolves the issue in your environment?
Hi! I opened a support ticket, that told me to the same thing to Sophos. I've tried contacting my IT manager, but he says he is not able to add those exclusions, he escalated to other people. When I will have news I will publish here and also reply to the ticket. For now, thanks for your help!
Hello!
So, it seems it is a bug in Sophos, they will release a fix next time a production release will be made.
Thanks for your help!