No event when profiling with dottrace commandline vs using dotnet ui

Hello !
On my local desktop (Macos Arm64), I experiment with the dottrace command line tool.
I start the basic web app from microsoft and attach the dottrace profiler with :
./dottrace attach 2306 --save-to=./../snapshots/snapshot.dtp --timeout=65s --profiling-type=Timeline
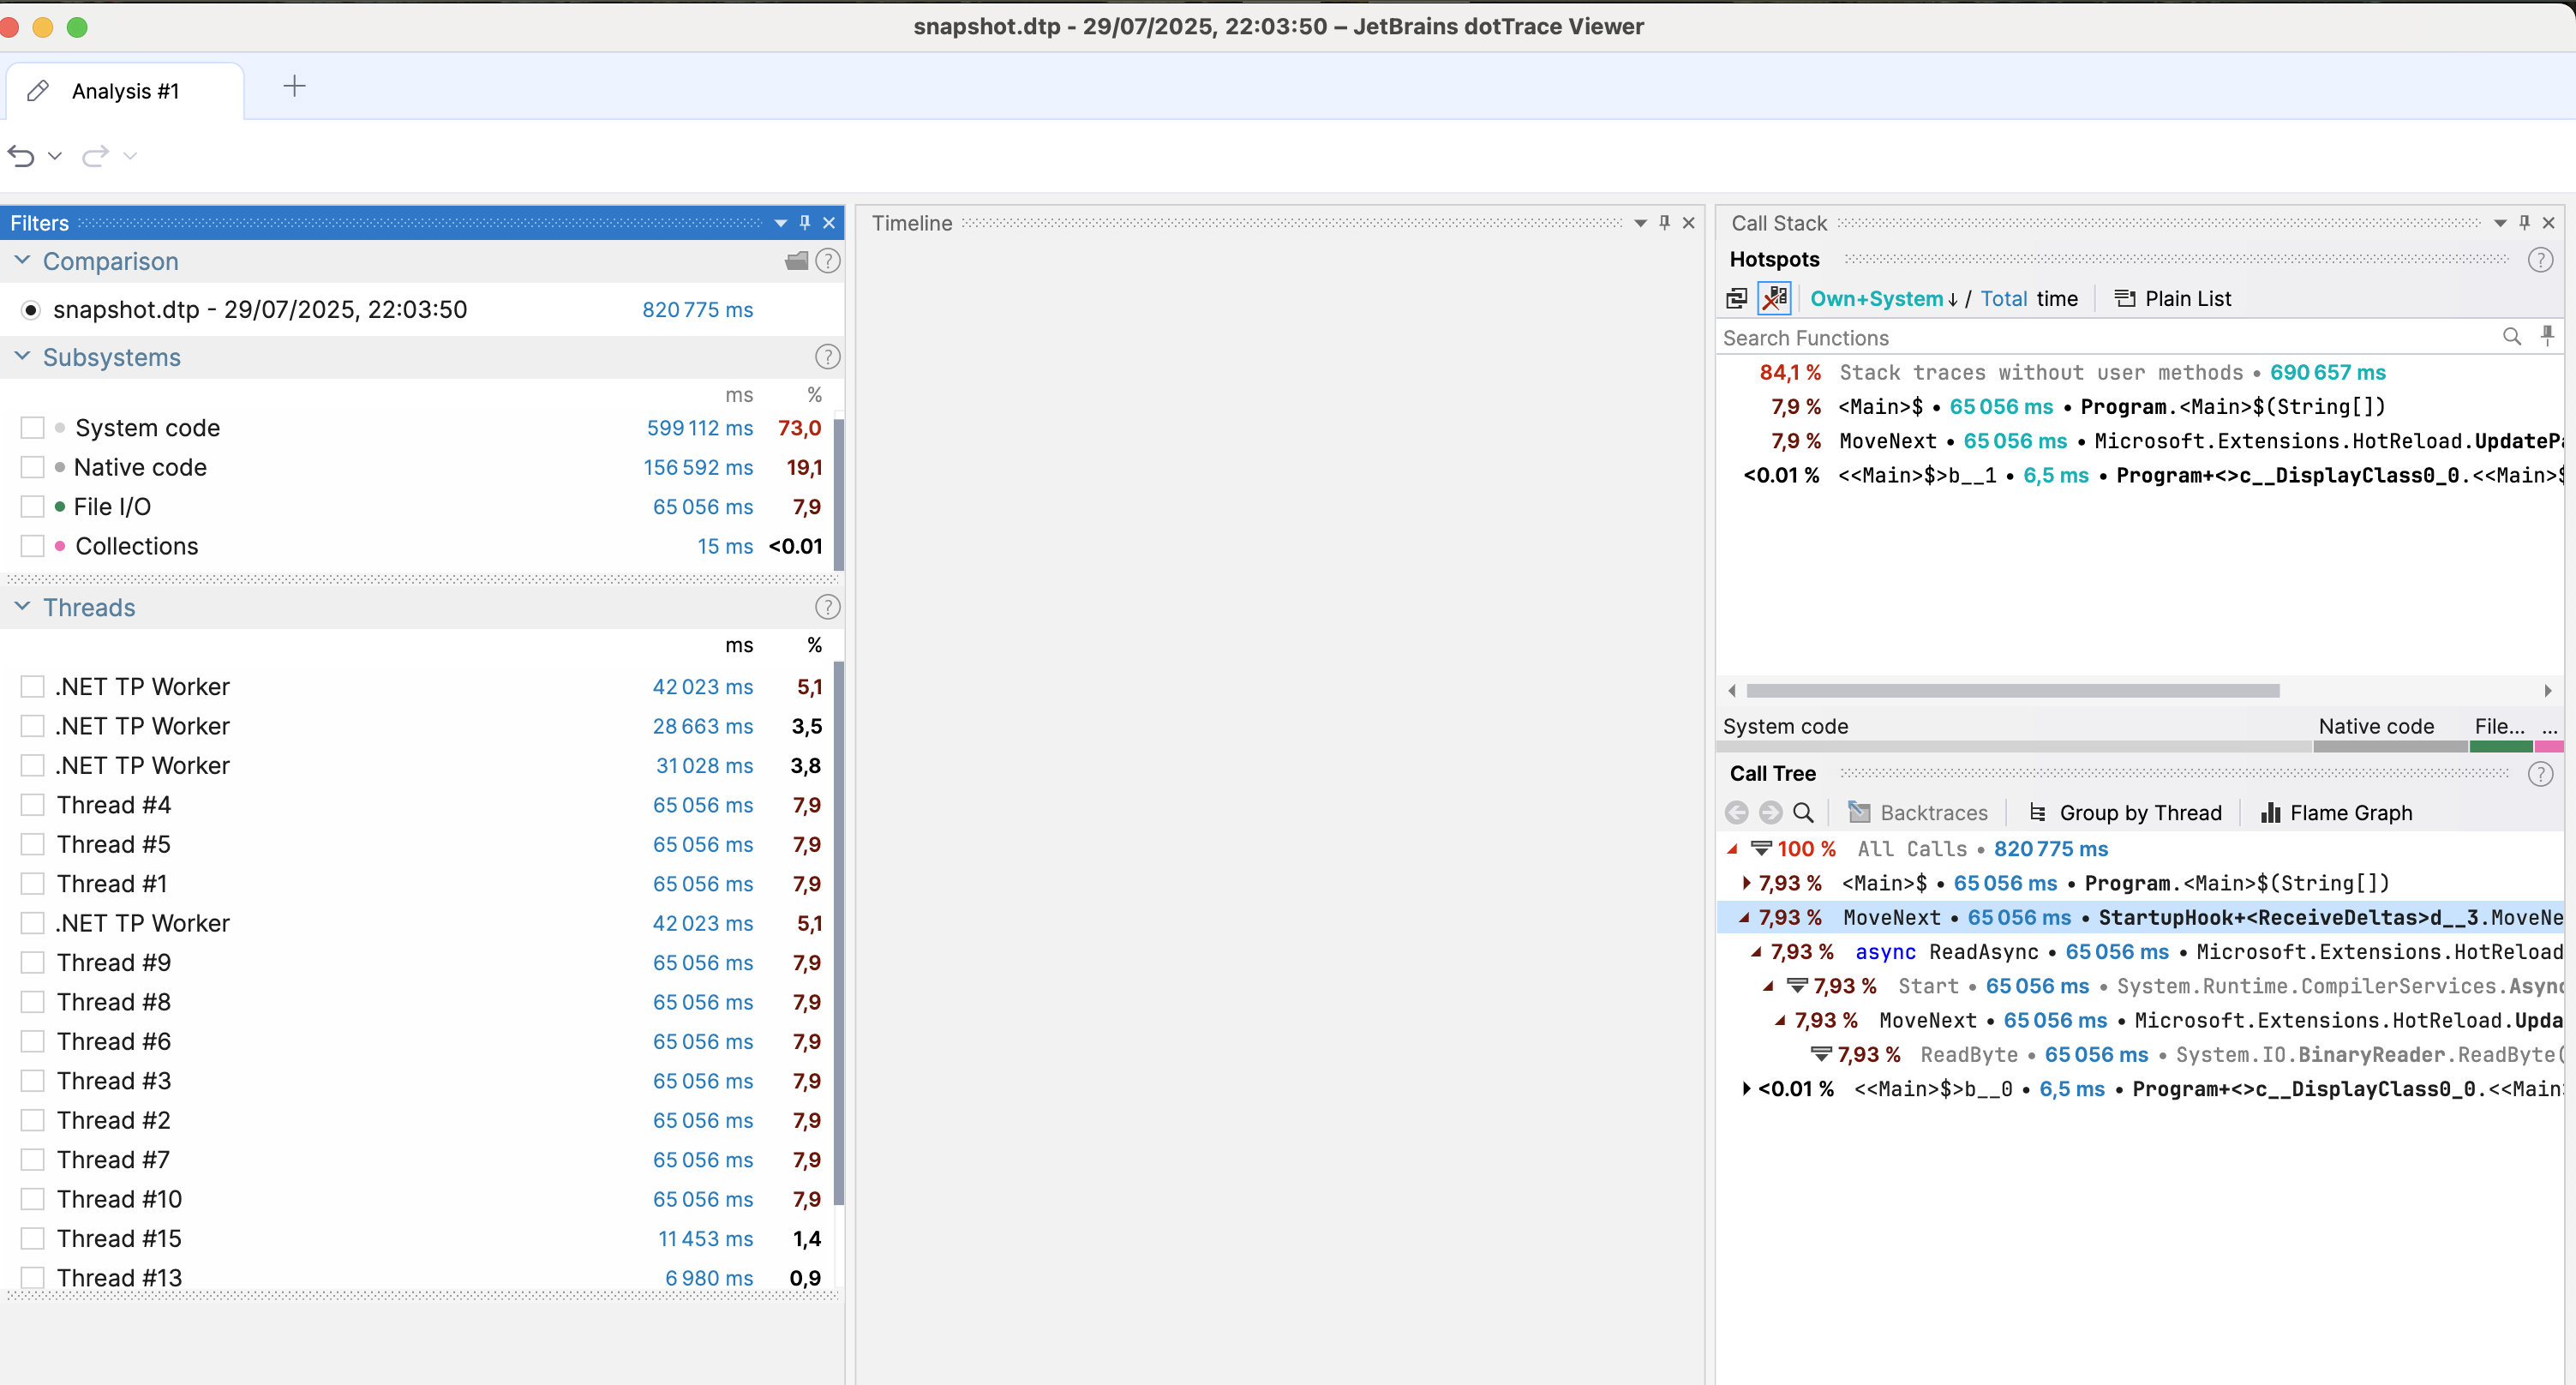
I open the snapshot in dotnet ui and their is no event view :
I profile with dottrace UI and Timeline also and i get a more complete overview of my profiling session with events :
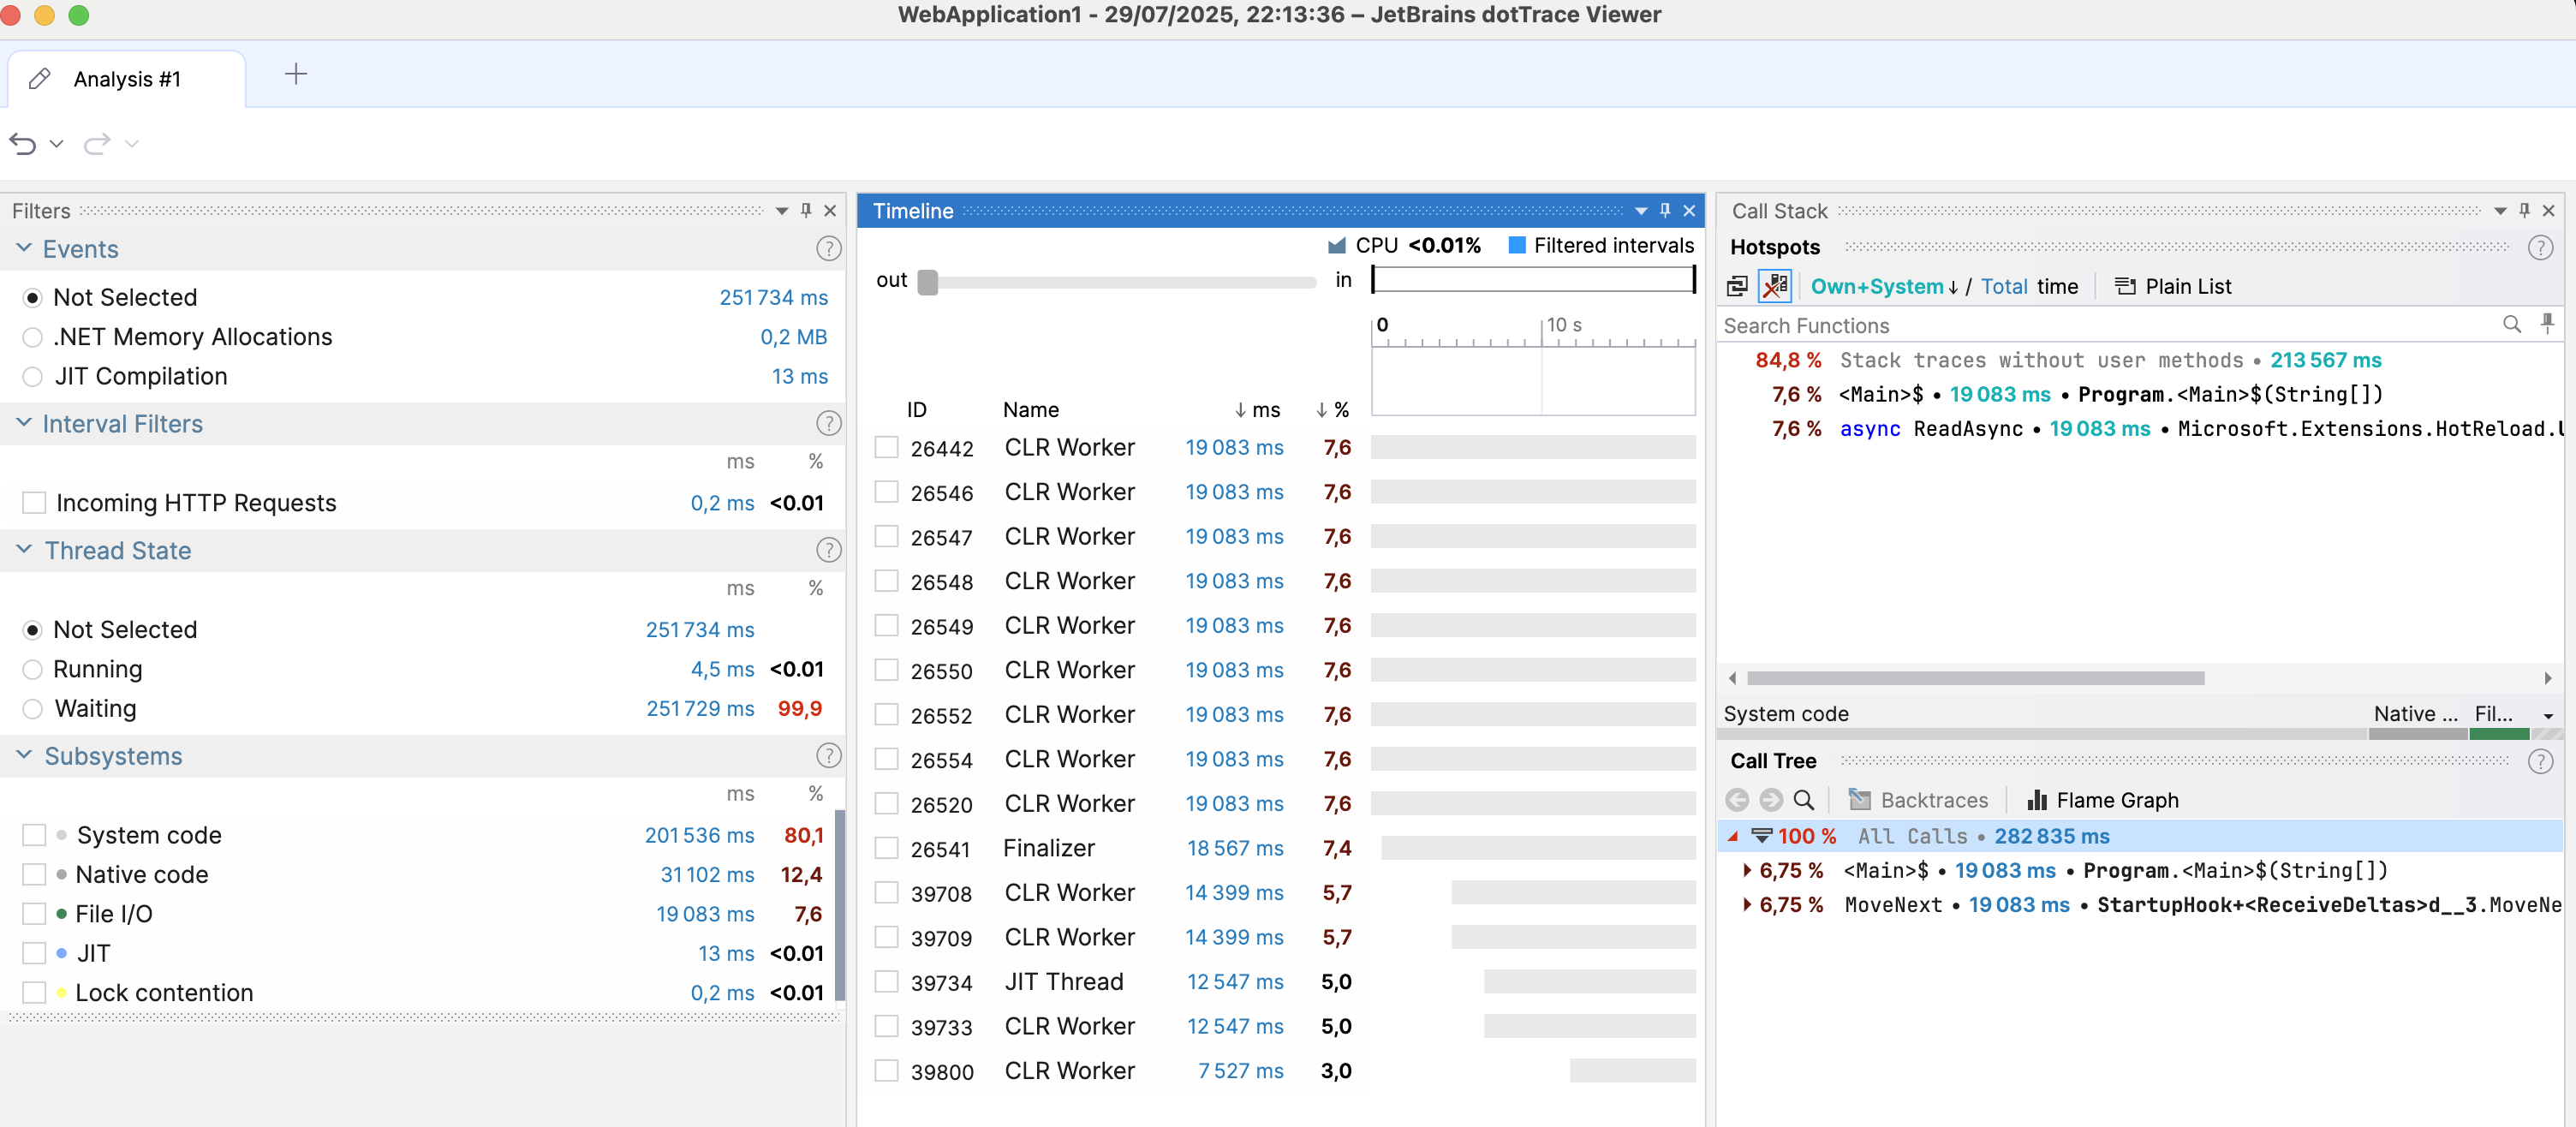
I am missing something in the command args to get the same view ?
Please sign in to leave a comment.
> I open the snapshot in dotnet ui and their is no event view
According to the screenshot, you're viewing a snapshot taken in “Sampling” mode. Please note that the “Event View” is not available in this mode. It looks like you might have opened the wrong file. Could you double-check and make sure you're selecting the correct snapshot taken in “Timeline” mode?
I retry and it was fine ! THk !