New to dotTrace, could someone help with review of snapshot.
Hi Folks,
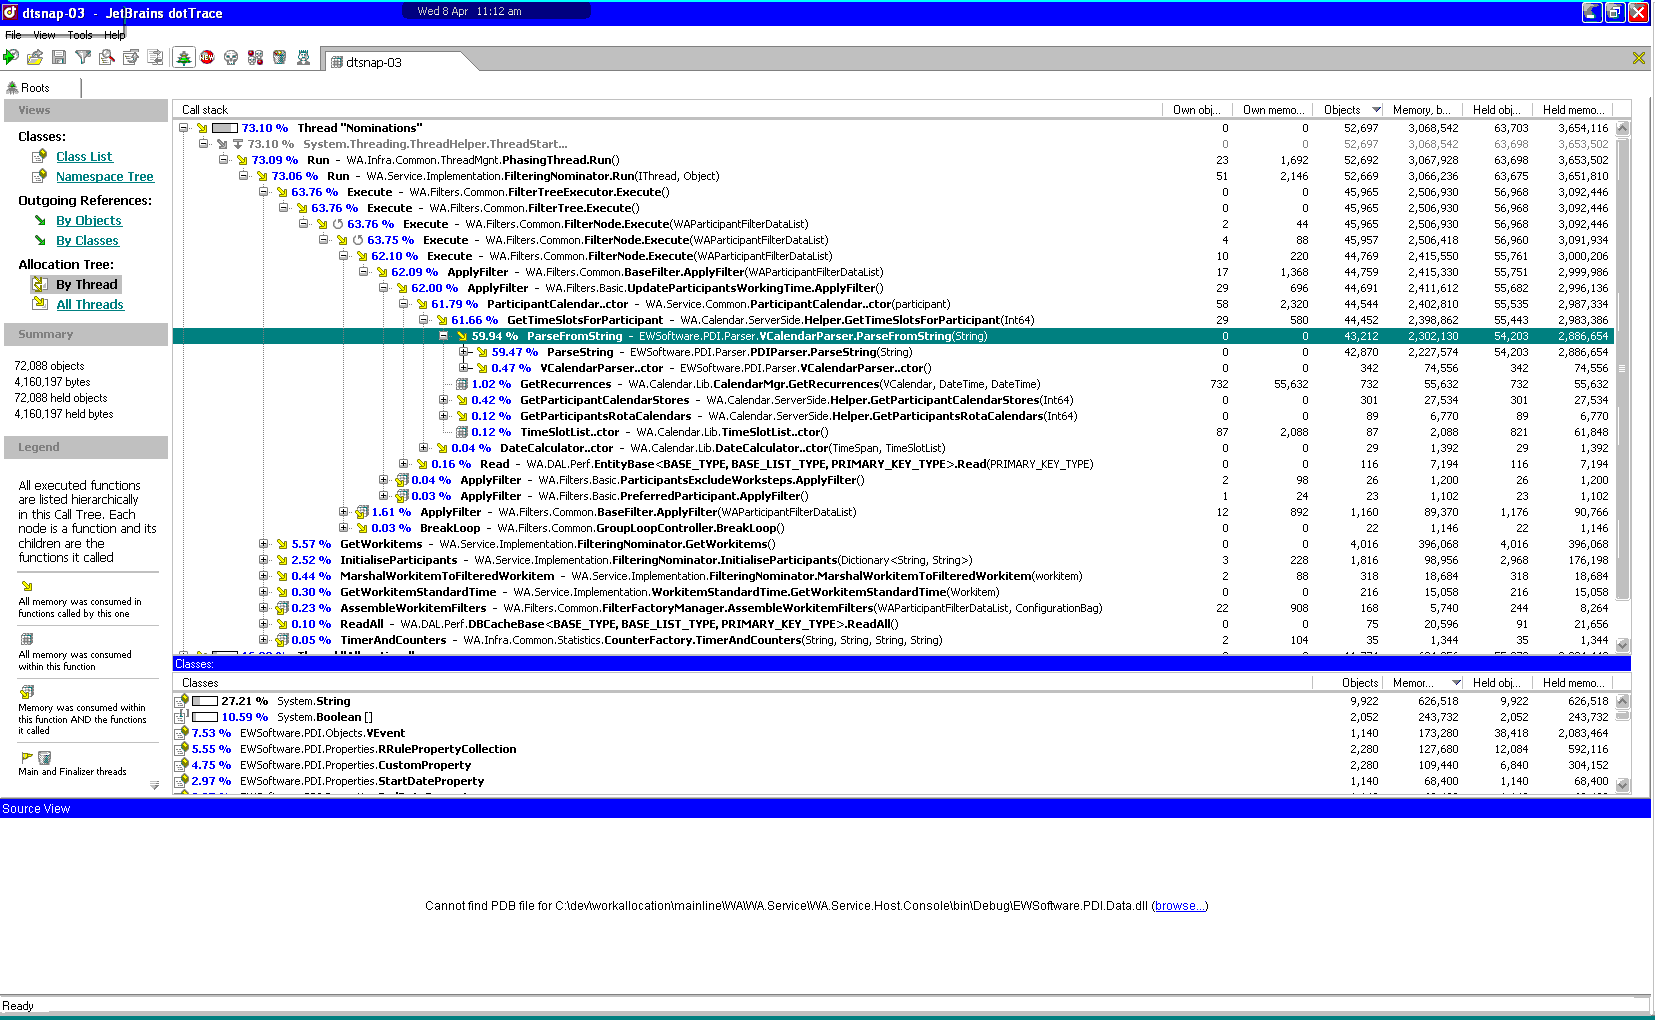
I'm new to dotTrace and am wondering if I am reading this snapshot correctly. I was wondering if someone would be kind enough to review it and see if my understanding of the snapshot is correct. I've attached a couple of small bitmaps which are screen grabs of the allocation call stacks.
With the attached pictures of the snapshots, I started the trace as a "Memory profile". I had "record allocation callstacks", "start recording immediately", "Allow recording garbage collection" and "allow recording finalized object information" all enabled.
I took 4 snapshots over the course of the lifetime of the run. I have attached pictures of the call stack for the 3rd & 4th snapshots.
My reading of this is that there is 1 function in particular which does not seem to be releasing memory, it would appear to be the ParseFromString method which is consuming the memory and not releasing it, 71.41% (in the 4th snapshot) of memory would appear to be allocated to that method.
When I look at the held memory and held objects these are always increasing so in my understanding this would appear to be a memory leak.
Is my reading correct, or is this just showing where the memory was allocated? and not what is actually holding the memory.
Kind Regards
Noel.
Attachment(s):
dottrace-04.bmp
dottrace-03.bmp
Please sign in to leave a comment.
Dear Noel,
Sorry for delay. This view only shows where objects were allocated. There are 4 colums:
- function name
- own object/memory (how many objects were allocated only by this function)
- object/memory (how many objects were allocated by this function and its children)
- help object/memoty (how many objects will be deleted by GC if all objects in this function and its children disappear)
WBR, MIkhail Pilin
Thanks very much for the reply Mikhail. It is what I thought. But in the case where the Heap Byes is always increasing and never reduces even after garbage collection has run (either forced or not) would I be correct in my reading that this is an indication of a possible memory leak? The methods being invoked should not be holding memory permentently and the heap bytes never reduces over the lifetime of the application.
Kind Regards
Noel